Maximizing on-shelf availability for CPGs with Machine Learning
1. Introduction
As the CPG industry moves towards adopting & applying AI and ML solutions to more complicated use cases, there are a few low hanging fruits which have not been tackled by the wider industry yet - manufacturers and retailers alike!
Despite the COVID-19 pandemic, the consumer packaged goods industry reported record sales in 2020 and sustained growth in 2021. However, in the US, 7.4% of sales were not realized due to out-of-stock/ out-of-shelf items, costing retailers $82 billion in 2021 alone [Nielsen IQ 2022].
On-shelf availability (OSA) and consequently the accuracy of reported inventory is one such challenge which is increasingly becoming a primary focus area for a number of manufacturers in the recent period, where the focus is on identifying inventory compliance gaps in the retailer network, and driving retailer’s adherence to ensure sell-out maximization.
While retail technology has been steadily improved over the last decades, many operational factors still contribute to generate inventory record inaccuracies including:
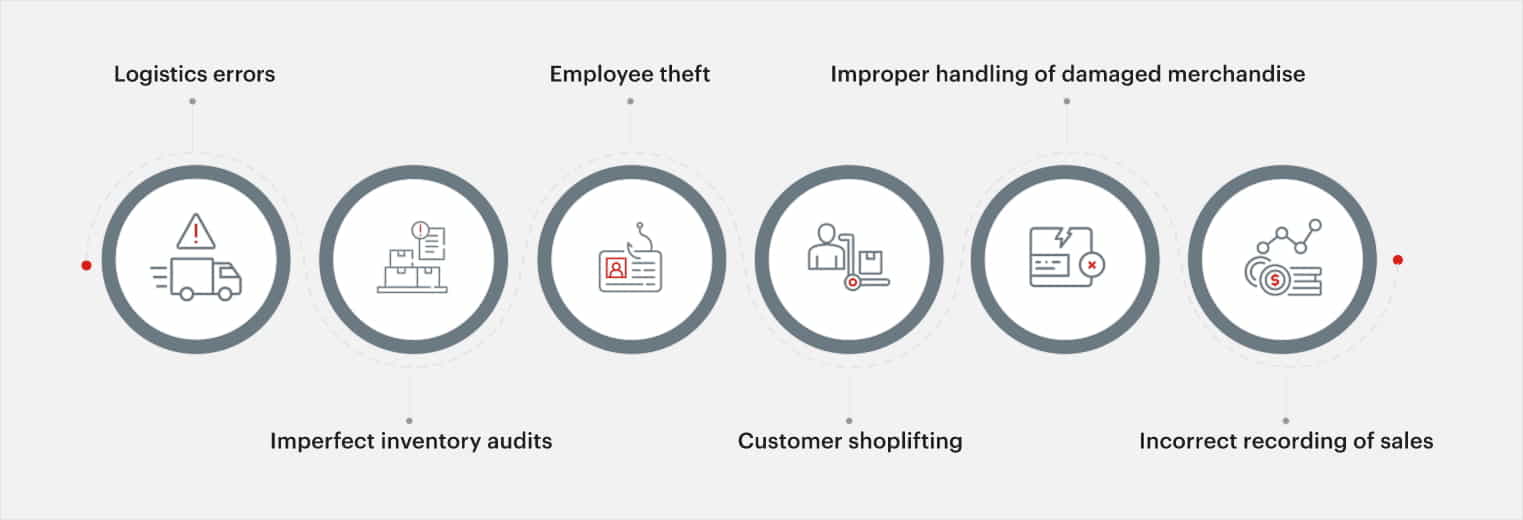
Market studies indicate that the average inventory accuracy amongst retailers is staggeringly low, ranging between 60 to 65% [MarketScale].
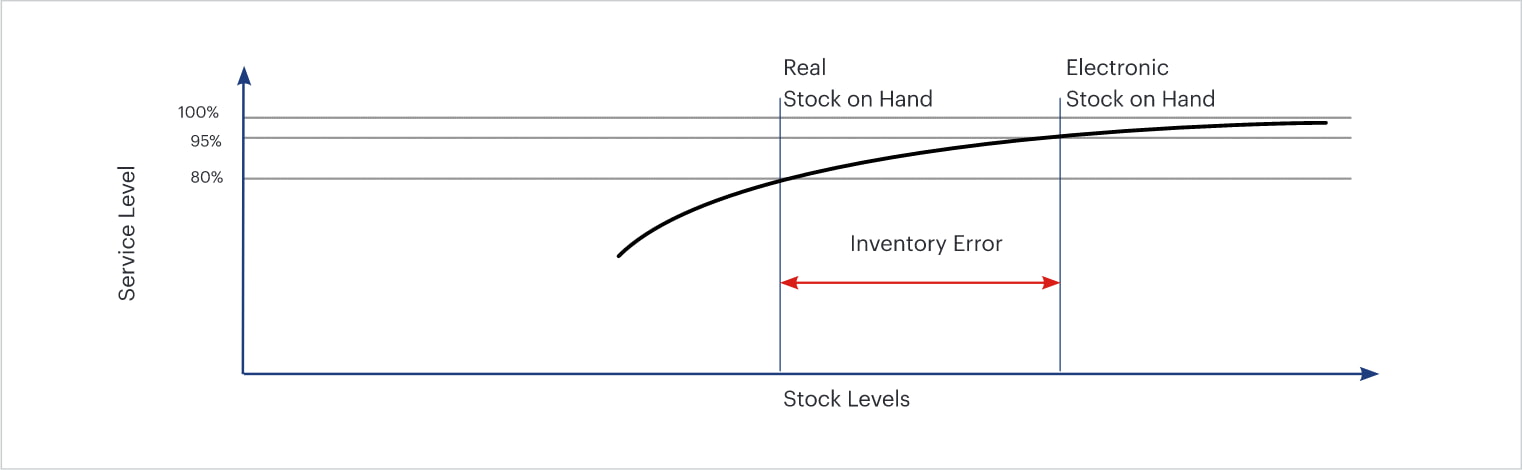
Figure 1 illustrates how a wrong inventory record will not only block a replenishment trigger required to backfill the quantities, it will also be leading to low service level, i.e. greater number of zero sell-out scenarios.
While the On-ground sales team’s sample audits can provide an indicative (sampled) view into a retailer’s inventory practices, we propose looking at the issue supported by Advanced Analytics approaches.
In the next section, we will discuss two specific inventory inaccuracy scenarios and their typical data behavior
2. Problem areas studied
In this whitepaper, we discuss two problem areas impacting the quality of On-shelf availability

Phantom Inventory

Put-away compliance
(I) Phantom Inventory - Mismatch in digital vs. physical inventory
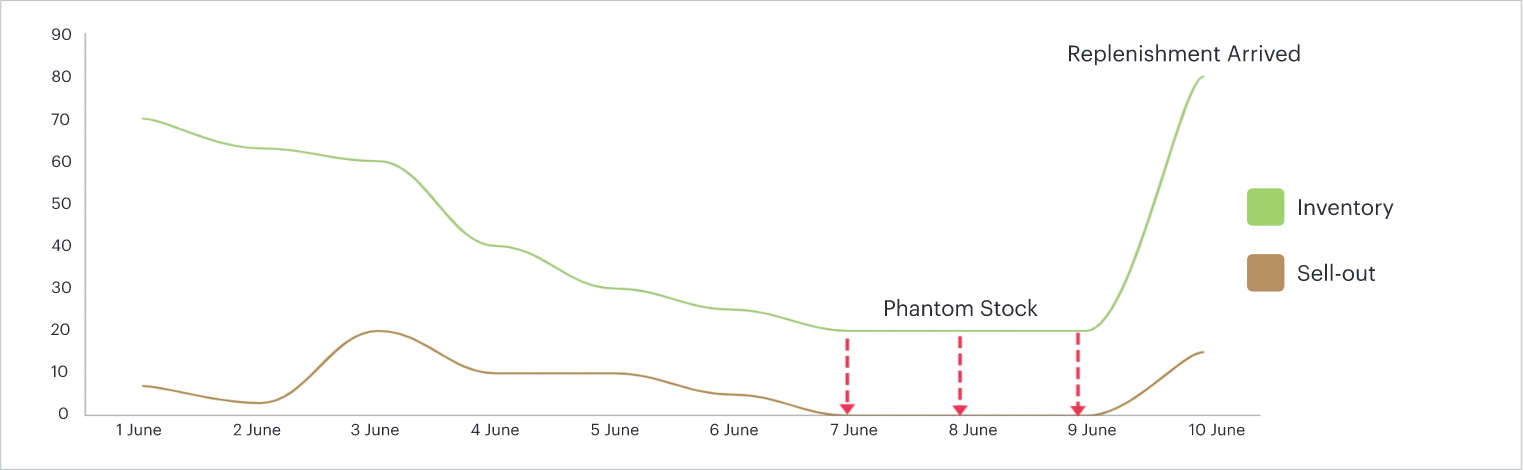
This scenario reveals instances of incorrect inventory reporting, wherein the gap between physical and digital inventory files has been creeped in due to some of the reasons mentioned in the previous section. In our analysis, we will be focussing on the phantom inventory scenarios where reported inventory is higher than physical inventory, particularly the negative effects of this on sell-out. This gap is termed here as “phantom inventory”.
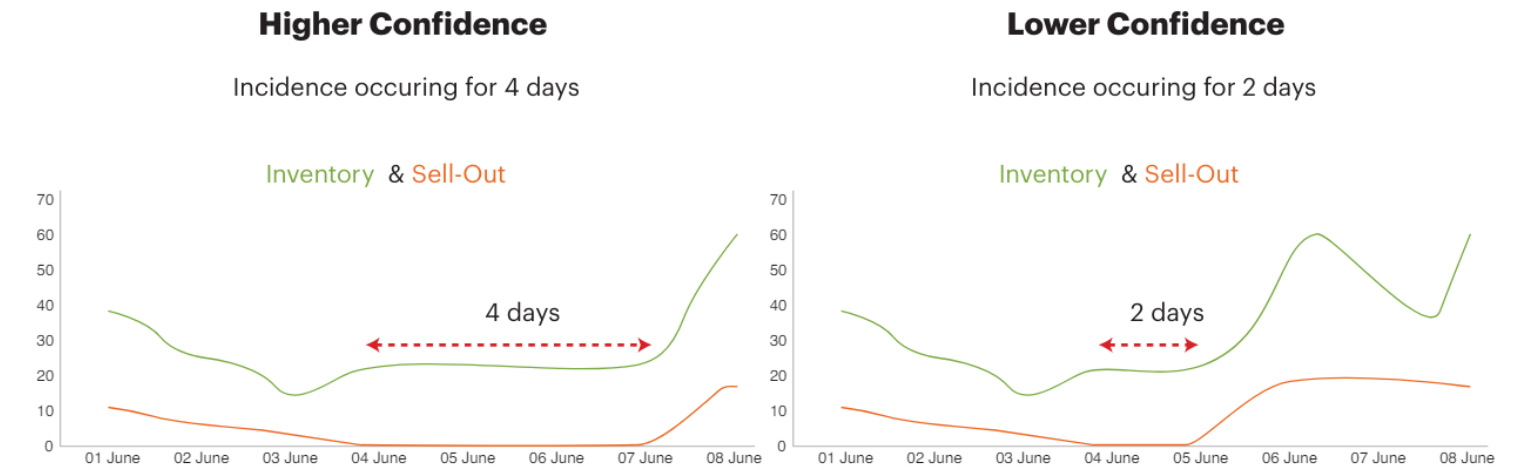
Looking at the behavior of Inventory and Sell-out lines in Figure 2 - when the reported inventory level stays at a level >20, we see non-zero sell-out events taking place for 3 days consecutively, indicating that the retailer has “likely” run out of physical stock and has no physical units to present to the prospective customer. These zero sell-out events continue till the store has received more inventory through replenishment, post which sales start picking up again.
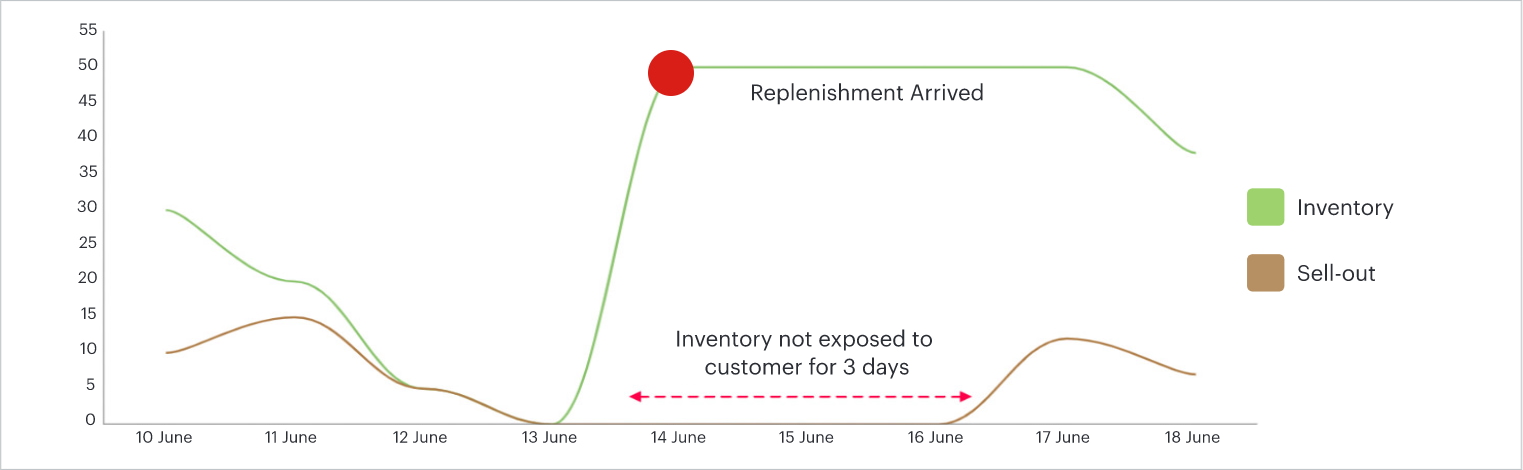
(II) Put-away compliance - Delay in shelving the received items
Inventory sent to the store for a special promotion is often marooned in the backroom because store managers didn’t run the promotion or stocked the products in a haphazard way. Per industry best practices, a manufacturer expects a retailer to stock their shelves with the received inventory overnight or within a 24 hours period.
However, looking at the behavior of Inventory and Sell-out lines in Figure 3, we see that as soon as inventory is credited into the store’s digital file, we see zero sell-out events occurring for 3 days consecutively before sales picking up again, “likely” indicating that although retailer has received the scanned inbound stock, the stock is dwelling in the store back-office for 3 days before being put on the shelves.
Notice the word “likely” in both observations above, we call these as likely scenarios because there are always probabilities of false positives, i.e. there could be natural zero sell-out events happening at a given inventory level, and our data points necessarily are not all indicating an inventory compliance issue at retailers location. Example, we may be seeing zero sell-out events at a certain inventory level because there is no customer demand, which in turn could be due to,

low footfall

high prices

competitors’ products under heavy promotion

retailer intentionally holding back stock in back-office if the stock is supposed to be exposed only starting a given date
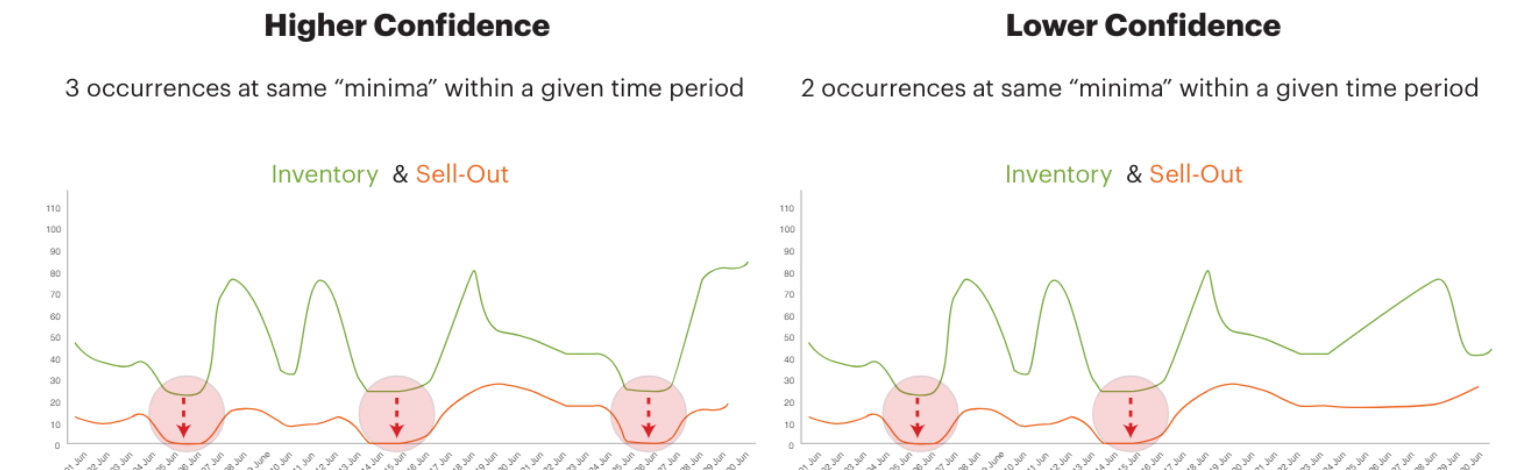
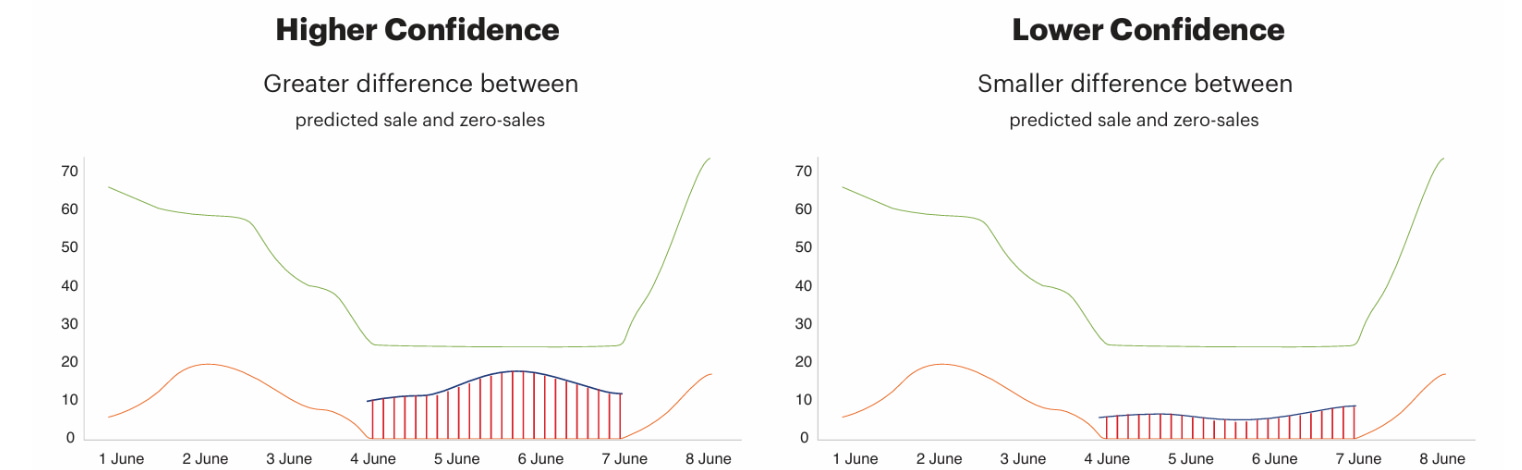
Hence, to understand confidence in the Phantom and Put-away non-compliance events, we will substantiate the analysis with demand probabilistic components (taking into account above listed factors) and categorize events into High/Medium/Low confidence buckets.
3. Solution approach
A total 2 years of Daily inventory, sell-out and sell-in data was ingested, harmonized and prepared for the analysis. 1st stage of analysis involves identifying the phantom & PCA instances across timeline by isolating
- Incidences of continuous zero sales (for minimum 2 days) in the store coupled with an inventory minima (phantom)
- Incidences of zero sales (for minimum 2 days) in the store coupled with a post replenishment scenario (PCA)
- Phantom & PAC instances were identified across 480 stores and 73 products
- Out of total ~90,000 POS-product combinations in the network, we have this behavior present in ~10,000 combinations
- The analysis highlighted an annual opportunity of $0.45 Mn against studied annual sell-out of ~ $25 Mn in the portfolio & accounts in study (1.8% uplift)
- Solution was operationalised for daily refresh, and provided daily alerts to sales team to conduct audit / corrective actions in the market
- For Phantom instances that were tagged “High” likelihood, 70% of instances were validated by the survey observations
- For Phantom instances that were tagged “Med” likelihood, 50% of instances were validated by the survey observations
- Or Phantom instances that were tagged “Low” likelihood, only ~25% of instances were validated by survey observations
A simplistic illustration of the output format focussing on phantom inventory incidence identification and confidence assignment is given below.
| Date | SKU ID | Store ID | Phantom Flag | PAC Flag | Phantom Conf_1 | Phantom Conf_2 | Phantom Conf_3 | Overall Confidence Score (Phantom) |
|---|---|---|---|---|---|---|---|---|
|
1 Jul ‘22 |
Prod1 |
Sto_1 |
1 |
0 |
0.8 |
0.9 |
0.7 |
H |
|
1 Jul ‘22 |
Prod2 |
Sto_2 |
0 |
1 |
0.6 |
0.7 |
0.6 |
M |
Now, there is always a natural probability of zero sale event occurring on a product which could be independent of the inventory level that the store is holding.
We will brief upon the three approaches taken to bucket-ize the confidence we have in each instance,

A high confidence factor indicates that the zero sell-out behavior is a more likely to be anomaly which can be attributed to inventory accuracy issues

A low confidence factor indicates that the natural probability of zero sell-out behavior was highly expected and necessarily does not relate to inventory accuracy issues
4. Solution implementation and success story
In line with the functional responsibilities, key stakeholder and working groups involved in the solution implementation and validation methodology are typically the (i) Key accounts management team (ii) merchandising teams (iii) On-field sales teams (iv) Financial audit teams
Clearly, a white box solution approach described above needs to be taken through a Proof of Concept phase and needs to be calibrated as per the business environment before becoming completely self reliant.
Large scale CPG retailers have on-ground sales audit teams (either in-house or outsourced) which can be effectively used to cross-validate the solution observations, in addition to driving conversation with the retailers about non-compliance events.
An illustrative workflow which would support the action and decision process is as follows,
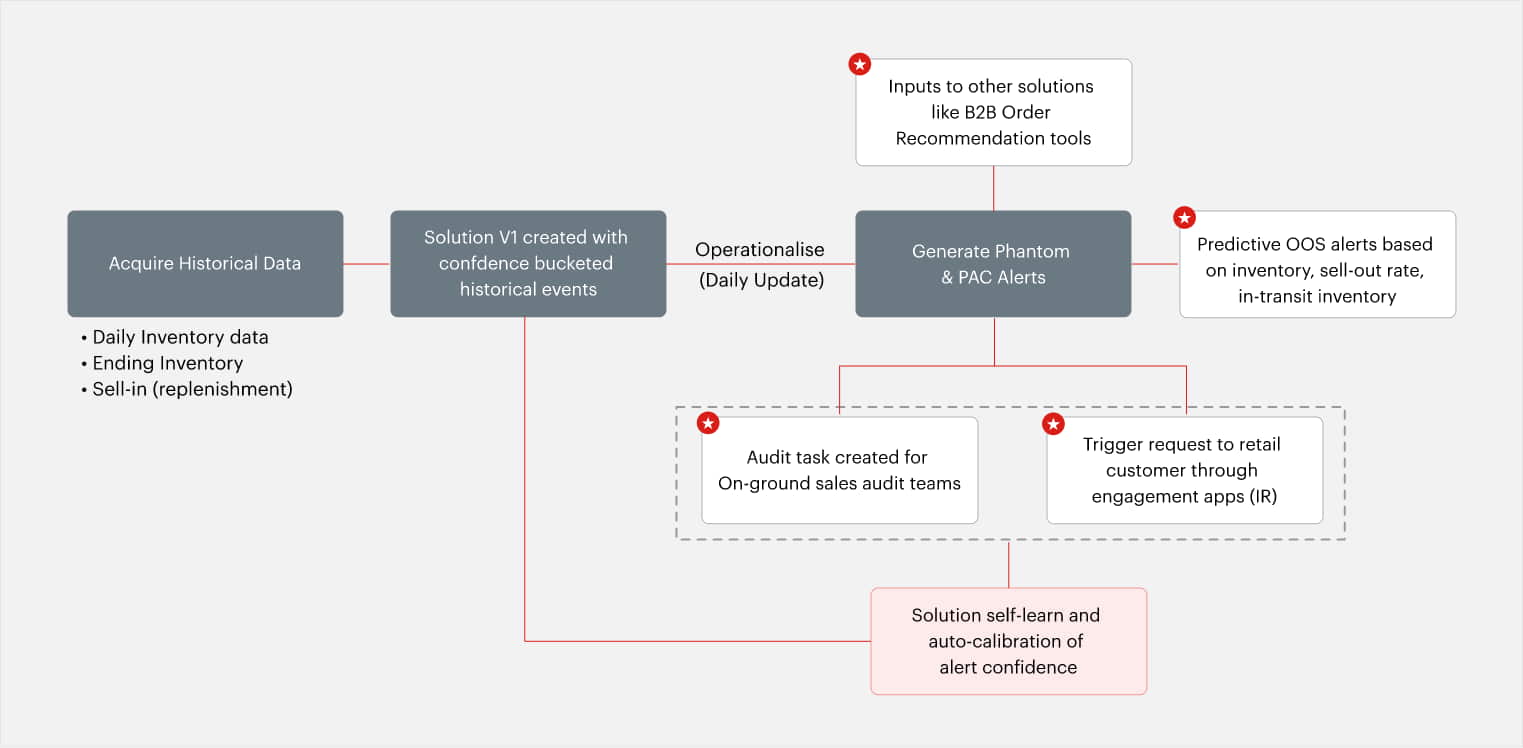
The analysis was conducted for a global CPG giant (snacks and beverages), for their organized trade channel
Validation of historical outputs
Using a historical sampling dataset available to the customer, we were able to validate the phantom OOS observations using the “on-site” observations called out by the field agents team.
Within the store-SKU-date combinations against which the survey data was available,
Conclusion
Maintaining accurate inventory records is a requirement to achieve a satisfactory level of inventory optimization. What is not measured cannot be optimized; and when a measurement is made, it has to be accurate. Yet, our experience indicates that most retailers suffer from poor inventory accuracy in stores. RFID represents a potential long term solution to this situation, however even RFID cannot tell if a product is damaged, misplaced or inaccessible.
Businesses should tackle their inventory inaccuracies and ensure data reliability, before moving to developing optimisation and recommendation solutions in the data ecosystem.
It goes without saying, that while the solution approach provides manufacturers with a tool to intelligently identify opportunities in the network, the real values can be driven through trust and continued collaboration between the manufacturer and the retailers.
About the author
Anurag Bhatia has around 10 years of experience in Retail, CPG and Utilities space. Domain exposure cuts across strategy, transformation and analytics capabilities setup for some of the largest Fortune 500 organisations.