Global COVID-19 Scenario: A Data Scientist’s Perspective (Part 1)
Reading Time: 7 minutes

Amidst the COVID-19 pandemic, people & businesses alike are trying to analyse the spread of the disease in their country and see how they fare in comparison to the rest of the world. While at Sigmoid, we are constantly working on applying data science and analytics to support enterprises with COVID Analytics. I wish to share the impact of a study that I undertook on a personal front.
In the first part of this blog series, we discuss our exploratory data analysis on how countries are tackling this unprecedented global scenario.
Many governments have taken similar measures to curb the spread of COVID-19. Enforcing a lockdown is one such approach, and as we have now seen, the timing and severity of implementation are equally crucial. Countries who have delayed the implementation even by a few days, or failed to ensure a strict lockdown, are now bearing the brunt of this pandemic.
In order to perform our analyses, we used data compiled by Johns Hopkins University, our world data website, and a few contributors in Kaggle. We did exploratory data analysis using Python and some columnar transformations to get derived columns like relative days since the 100th confirmed case, daily new cases. Visualizations were then plotted using python libraries and excel pivots. These visualizations have been made simple and easy to comprehend.
As the novel coronavirus spread beyond the confines of China, a much larger population was exposed to it. Millions of people across the Middle East, Asia, Europe and the USA were impacted, causing severe damage and disruption in their daily lives. As the world tried to come to terms with what had hit them, the casualties kept increasing at a steady rate.
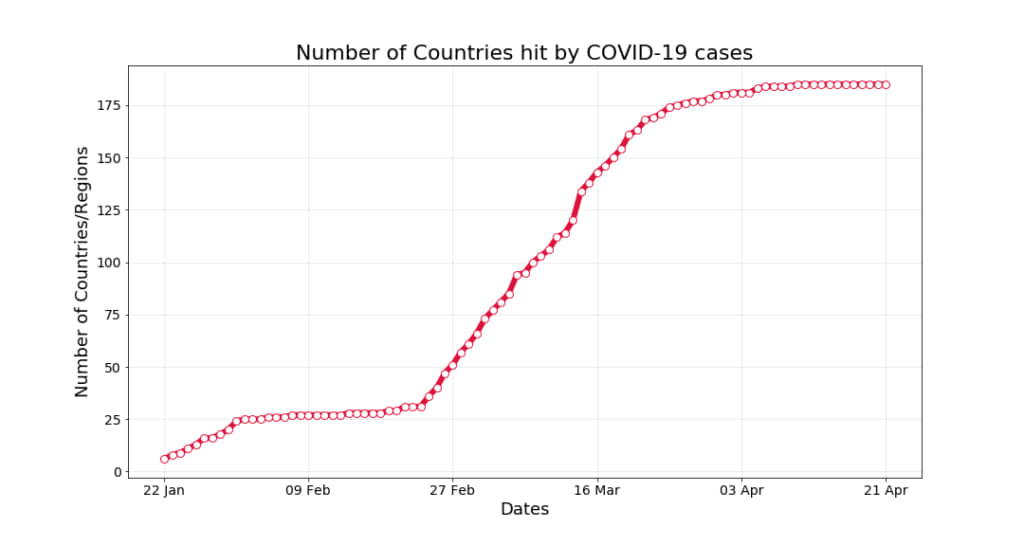
Figure 1: Number of Countries hit by COVID-19 cases
The World Health Organization (WHO) declared this outbreak as a public health emergency by 30th January and categorized it as a global pandemic by 11th March. Just over a month later, the total number of countries affected stands at 187 (Source: Johns Hopkins University, 21st April).
Current Global Scenario
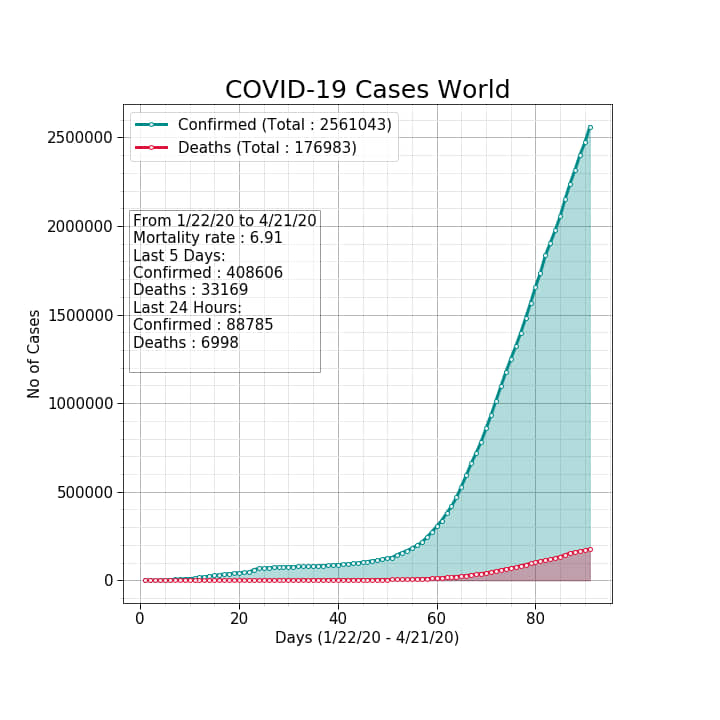
Figure 2: Number of COVID-19 cases across the world
The daily count of confirmed cases, deaths, and also the recovered cases across the globe have been exponentially increasing since January 2020. This dashboard by the World health organization gives us an overview of the scenarios of this pandemic in a snapshot.
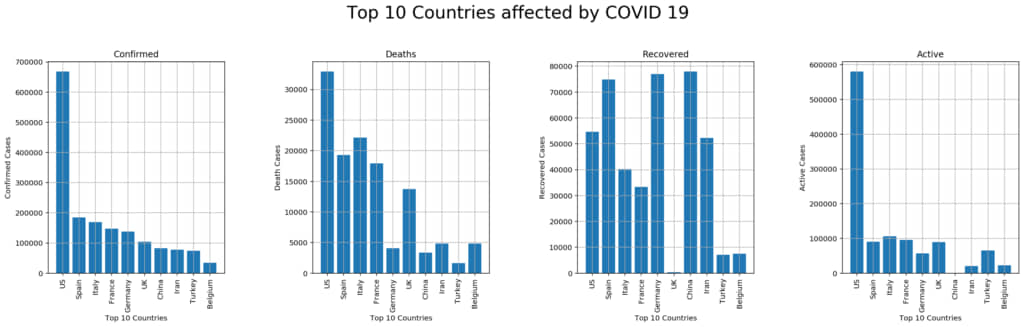
Figure 3: Top 10 countries affected by COVID-19
The top-10 countries that took the worst hit are USA, Spain, Italy, France, Germany, China, Iran, UK, Turkey and Belgium. The mortality rate (total deaths over total confirmed cases) and recovery rate (total recovered over total confirmed cases) have been fluctuating and are different across countries, widely due to the geographic, socio-economic and political differences, as well as the measures taken by their respective governments. The primary reasons for an exponential spread of COVID-19 cases in these countries are either delayed action in locking down the province/country, or lack of aggressive testing since identifying the first case, or both.
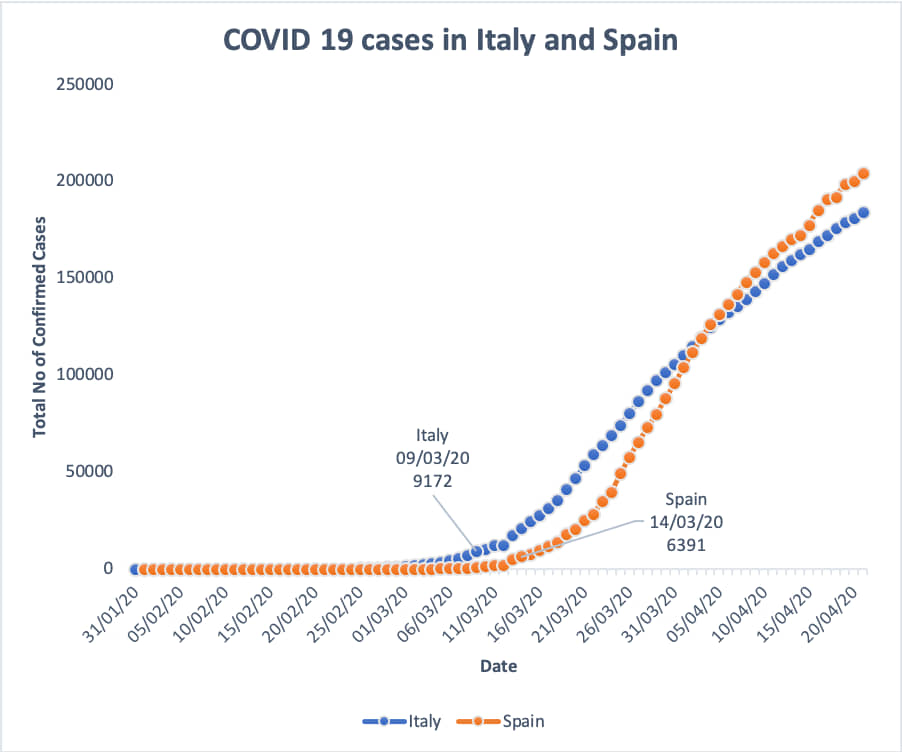
Figure 4: Comparing the number of COVID-19 cases in Italy and Spain
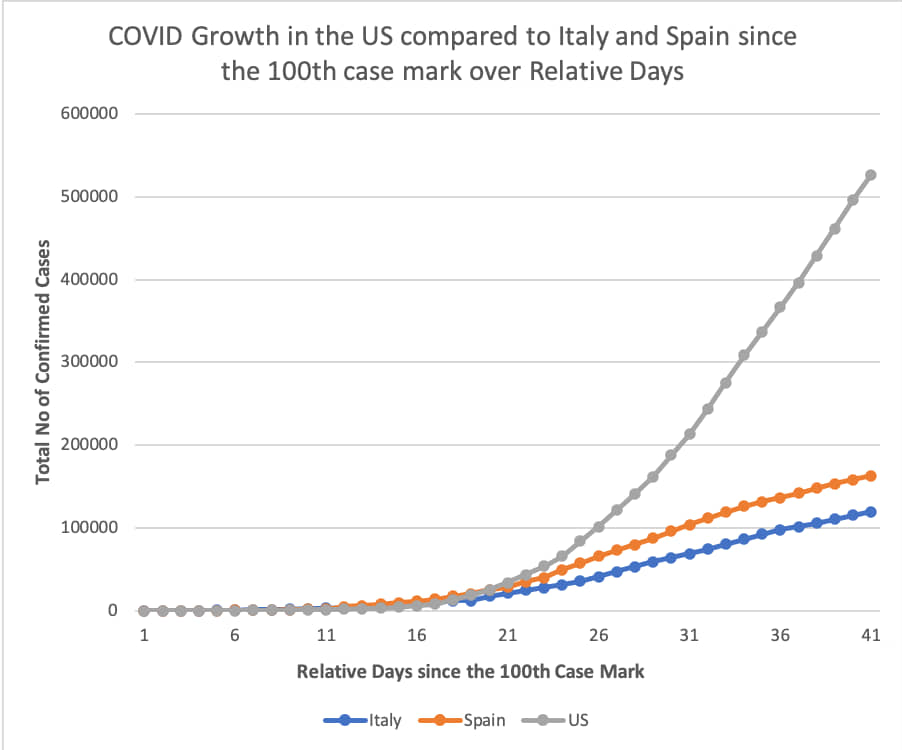
Figure 5: Growth of COVID-19 cases in Italy, Spain and USA, since the 100th case mark
Italy had imposed a lockdown from 9th March, when their confirmed cases were already 9172! Spain followed suit, imposing a lockdown from 14th March with 6391 confirmed cases. The number of new cases has been going down only after a month of strict lockdown in both countries. Also, the novel coronavirus has a 14 day incubation period, which explains the steep increase in the cases despite having a lockdown. The USA is now the worst-hit country by COVID-19, with the main reason being a lack of stricter social-distancing measures and enough testing and hospital facilities. Considering the 100th-case mark a milestone, we compared the spread of confirmed cases in the top 3 worst-hit countries over the relative days after each country hit this mark. This clearly shows how bad the situation in the USA is.
Countries That Managed The Crisis Well
Few countries like China and South Korea have handled the spread of this pandemic effectively. With a recovery rate of 94.6% , China has the highest percentage of recovered cases, followed by South Korea at 69.1% (Source: Johns Hopkins University, 21st April). Interestingly, the global average recovery rate stands at a distant 25%.
Few other countries along with South Korea like Japan, Sweden and India who handled this crisis well by taking strict measures in the early stages and had a slower spread of disease since they reached 100th case in comparison with the Top 10 worst-affected countries.
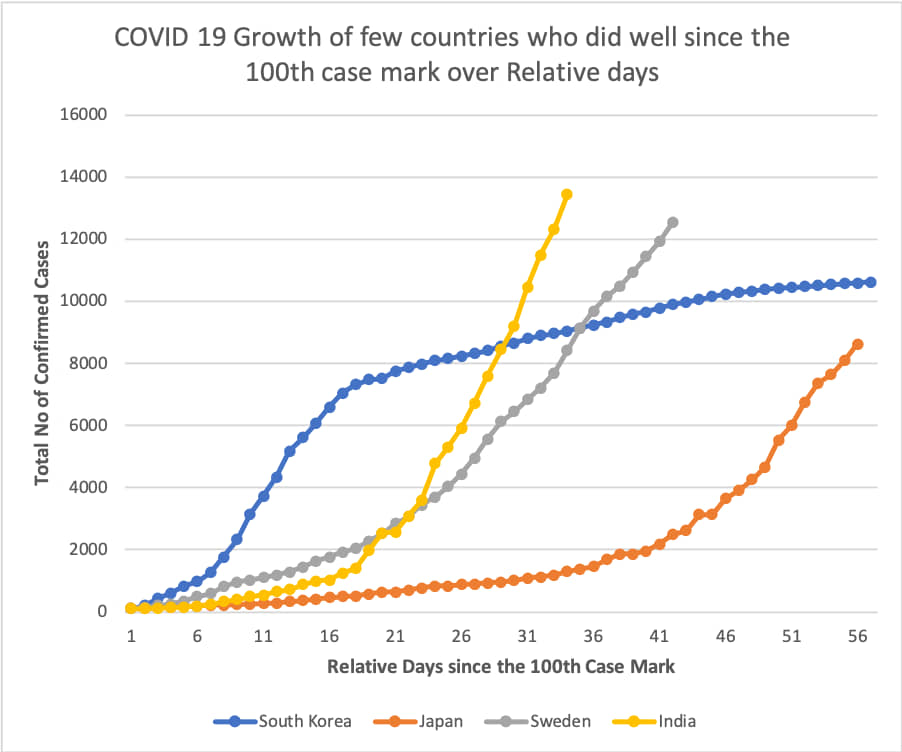
Figure 6: COVID 19 Growth of few countries who did well since 100th case mark in Relative days
- China
- South Korea
The place of origin of this deadly pandemic, China, was the first to witness an exponential spread in the number of cases due to COVID-19. They reacted quickly and implemented stringent measures to imply massive lockdowns, build makeshift hospitals, ensure mobile screening of patients, and deploy scores of people in teams to sanitize, quarantine and aid in the recovery of the affected people. Very few countries have been able to execute such measures effectively on a large scale. Though all of this has raised a lot of controversies and conspiracies in terms of world politics and global dominance, that topic is for another debate!
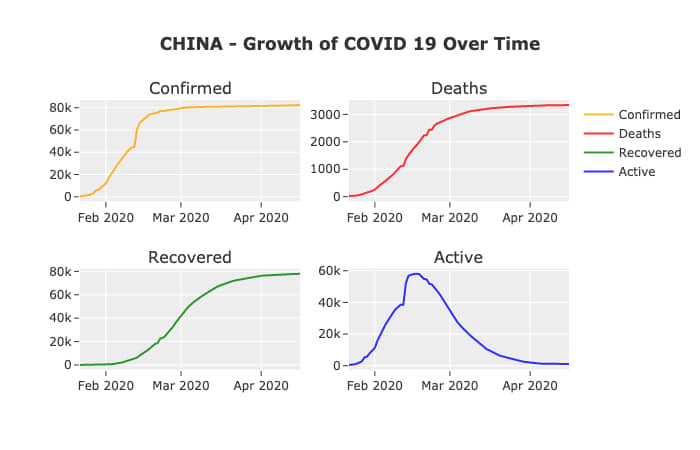
Figure 7: COVID-19 stats in China
China had imposed a lockdown on 23rd January, and the subsequent positive results were visible only after 17th February, when the number of new cases had gone down drastically. So it took over a month to curb the spread of COVID-19 after some stringent measures. As seen in the graph, the curve of the confirmed case has flattened in China since the end of February, and the number of cases recovered have increased since the middle of February.
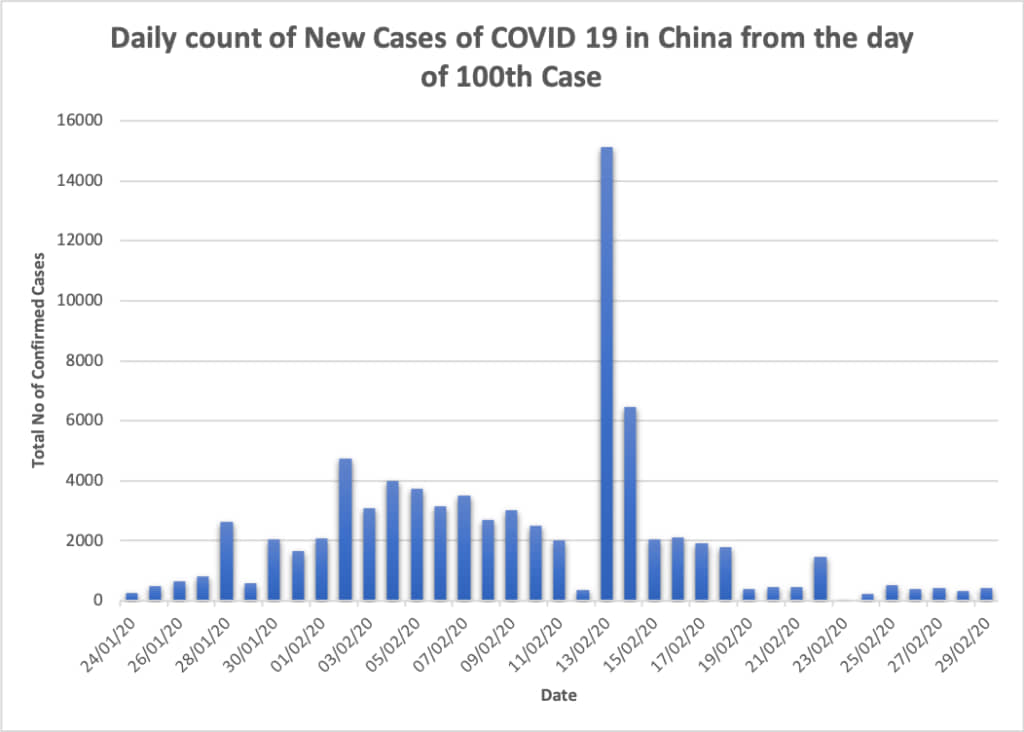
Figure 8: New COVID-19 cases in China post lockdown till end of Feb 2020
A lot of countries with such high population density, including India, were inspired by this model of three weeks lockdown and implemented it accordingly. However, the continued execution and resource allocation are key to curbing the virus.
Another country that has handled the current crisis well is South Korea. They have taken timely and tactical decisions with respect to schools and movements. Thus they were able to move ahead with minimum disruption even without undertaking any draconian measures.
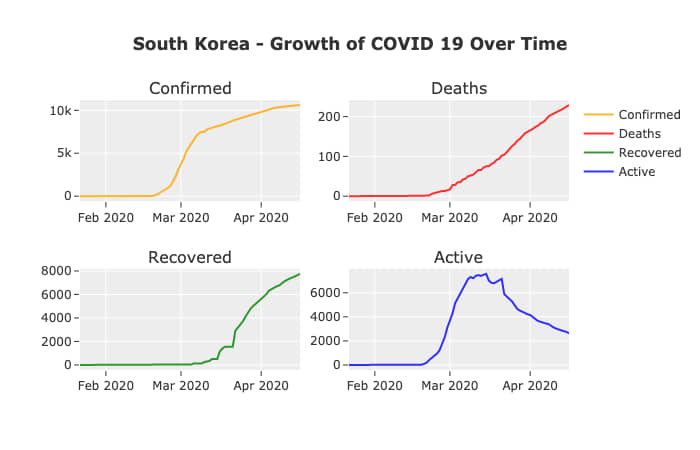
Figure 9: COVID-19 stats in South Korea
They identified that testing was the key to curb the spread of COVID-19 at the stem, and have screened more people per capita for the virus than a lot of other countries by far! By carrying out nearly 15,000 tests per day, health officials have been able to screen 250,000 people – about one in every 200 South Koreans – since February at a very early stage.
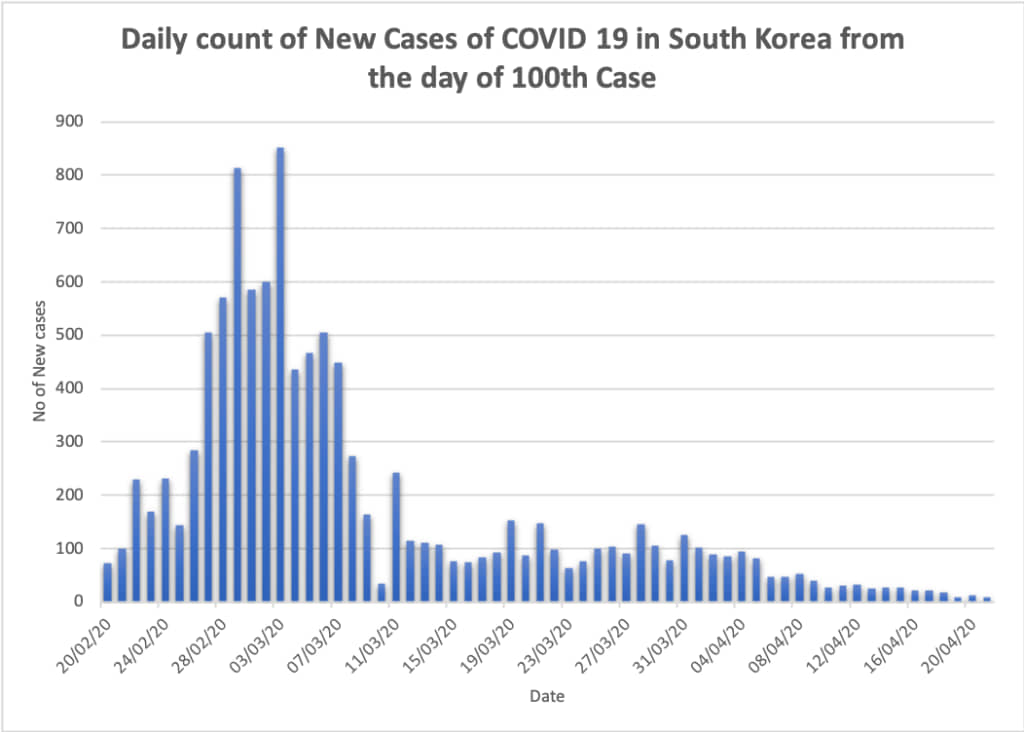
They crossed the 100th case mark on 20th February and were able to see a decline in the number of new cases by the 2nd week of March, i.e. within 3 weeks despite not imposing serious lockdowns, setting a new example to the world. Such methodologies are best suitable for countries having less population, and moderate to high GDP, as the testing kits are difficult to import or manufacture.
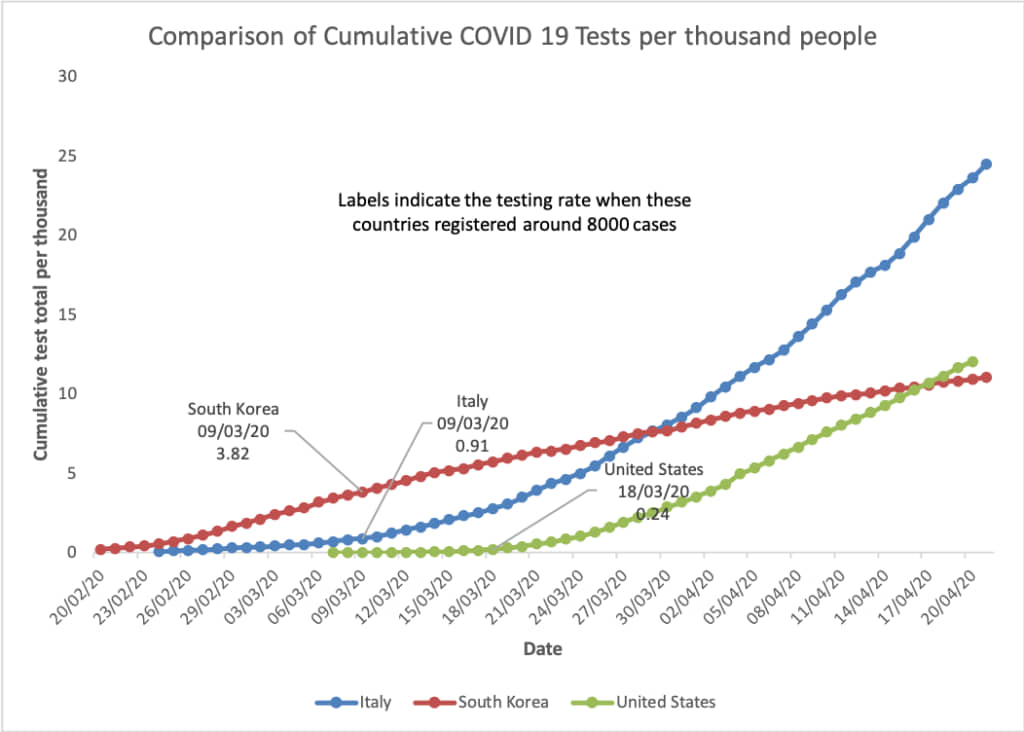
Figure 11: COVID-19 tests per thousand people
The cumulative total COVID 19 tests per thousand people of the country’s population chart above, shows how aggressively South Korea tested their people right from the early stages when they crossed the 100 cases mark (on 20th Feb 2020) in comparison to Italy, which also has registered around 100 cases during the same time period. And when compared to the US, they have not caught up with either of these countries in spite of having such a high number of cases.
Conclusion
With a lot of countries trying different measures to curb this problem, a lockdown has been the only successful option, besides aggressive testing and accumulating health equipment.
In part-2 of this blog series, we will assess the situation in India, analyze trends and comparisons with other countries, breakdown the effects of lockdown, and forecast the roadmap for a post-COVID-19 world using data science and analytics. Till then, stay safe everyone!
References:
Data Sources
- https://github.com/CSSEGISandData/COVID-19/blob/master/README.md
- https://www.kaggle.com/sudalairajkumar/novel-corona-virus-2019-dataset
- https://ourworldindata.org/covid-testing
Others
- Kaggle notebooks (downloaded and edited locally)
- WHO dashboard
- Timeline of the outbreak
- Article on the COVID-19 data
About the Author
Bhaskar Ammu is a Senior Data Scientist at Sigmoid. He specializes in designing data science solutions for clients, building database architectures and managing projects & teams.
Featured blogs


Featured blogs